Imagine a countdown clock in the crypto world that every four years sparks excitement and speculation. That clock marks the Bitcoin halving – a pivotal event hard-coded into Bitcoin’s design. In simple terms, a halving cuts the rate at which new Bitcoin is created, instantly making the asset more scarce. Why does this matter? Historically, each halving has been followed by dramatic shifts in Bitcoin’s price and market dynamics. From early enthusiasts in 2012 to today’s institutional investors, everyone monitors Bitcoin halving dates and their impact on BTC trends.
In this Brics Technology blog, we’ll explore what Bitcoin halving is and why it’s essential. We’ll walk through the history of the Bitcoin Halving Chart, examining key dates and price movements. You’ll discover when the last Bitcoin halved and what happened around that time. We’ll also decode the BTC halving chart & trends, spotting patterns repeated over past cycles. Finally, we’ll look ahead with predictions for the next halving and discuss why Bitcoin halving matters for investors – whether you’re a beginner, an experienced trader, or an institution.
By the end, you’ll understand Bitcoin’s halving history and how these events have shaped BTC’s journey. Let’s dive in!
Understanding Bitcoin Halving

Bitcoin halving is a scheduled event in Bitcoin’s code that halts the mining reward. To back up, Bitcoin runs on a blockchain where miners process transactions and are rewarded with a new BTC. Initially, this block reward was 50 BTC per block when Bitcoin launched. Approximately every 210,000 blocks (around four years), the reward is halved – hence the term “halving.” Miners suddenly receive 50% fewer bitcoins for each new block mined. For example, the reward dropped from 50 BTC to 25 BTC in the first halving, then to 12.5 BTC in the second, 6.25 BTC in the third, and so on.
Why design this decreasing supply schedule? It’s an integral part of Bitcoin’s economic model. By reducing the influx of new coins, Bitcoin creates controlled scarcity. Unlike fiat currencies, which can be printed in unlimited quantities, Bitcoin’s supply is capped at 21 million, and halving ensures the issuance rate slows over time. With limited supply, Bitcoin was built as a deflationary asset – similar to gold. Each halving event further curtails new supply, which curbs inflation and potentially boosts value if demand holds steady or rises.
From a price perspective, halving is significant because of basic economics: if fewer new bitcoins are being created. Still, interest in Bitcoin continues to grow, and the supply-demand balance tilts toward higher prices. Past investors have noted that Bitcoin’s price often trends upward after a halving, presumably because the “halved” supply creates a scarcity effect. However, it’s not a simple one-day spike; the impact plays out over months and years, influenced by many factors beyond the reduced supply.
It’s also essential to understand the impact on miners. Halving instantly cuts miners’ revenue per block by 50%. If the price of BTC doesn’t rise correspondingly, miners’ profitability drops. Due to the reduced rewards, less efficient miners may be forced to shut down after a halving. In the past halving, some miners temporarily leave, causing the network’s total mining power (hash rate) to dip. But over time, as prices recovered and mining technology improved, the network grew stronger. For everyday Bitcoin users and investors, the network effects are subtle – transactions keep processing normally – but the halving’s real drama unfolds in market charts and miner balance sheets.
In summary, a Bitcoin halving is a planned 50% reduction in the new BTC supply that occurs roughly every four years. It’s a crucial mechanism that ensures Bitcoin’s long-term scarcity. Next, let’s travel back in time and look at how the previous halving played out, using a Bitcoin halving chart history to guide us.
Bitcoin Halving Chart History
Bitcoin has undergone four halves, each marking a new chapter in its history. Below is a detailed table of past Bitcoin halving dates, the block reward changes, and how BTC’s price reacted at the time of each event and afterward. These key Bitcoin halving dates have become milestones for the crypto market:
| Halving Event | Date | Block Reward | BTC Price on Halving Day | BTC Price at Subsequent Peak | Increase (% Gain) |
| 1st Halving | Nov 28, 2012 | Reduced from 50 BTC to 25 BTC | ~$12.3 | ~$1,170 (Dec 2013) | +9,300% |
| 2nd Halving | Jul 9, 2016 | Reduced from 25 BTC to 12.5 BTC | ~$660 | ~$19,400 (Dec 2017) | +2,750% |
| 3rd Halving | May 11, 2020 | Reduced from 12.5 BTC to 6.25 BTC | ~$8,600 | ~$66,700 (Nov 2021) | +676% |
| 4th Halving | Apr 20, 2024 | Reduced from 6.25 BTC to 3.125 BTC | ~$64,000 | (TBD – as of early 2025) | (TBD) |
Table: Bitcoin halving dates, block reward reductions, and price performance. BTC price “subsequent peak” refers to the highest price reached in the bull run following each halving (typically 6–18 months post-halving).
Looking at the table, a few remarkable patterns stand out:
- Price Jump After Halving: Every halving was followed by a significant price increase within the next year or two. After the 2012 halving, Bitcoin’s price exploded from around $12 to over $1,000 within a year. The 2016 halving preceded a rally from ~$650 to nearly $20,000 by the end of 2017. Following the 2020 halving, BTC surged from about $8.6k to an all-time high of around $ 66k- $ 69k in late 2021. Clearly, bitcoin’s halving chart history shows a trend of exponential growth after each event, though the magnitude of gains has decreased in percentage terms each cycle.
- Diminishing Returns: The percentage gains have trended lower as Bitcoin matures. The first post-halving bull run saw over 9,000% gains, the second around 2,750%, and the third around 676%. This makes sense as Bitcoin’s market cap grows. Doubling or tripling in price involves much more significant absolute money inflows, so we shouldn’t expect the same crazy percentage jumps as in the early days. Still, each halving has led to new all-time highs for BTC prices within the subsequent cycle.
- Higher Base Price Each Halving: Another notable fact is that Bitcoin’s price at each halving has been higher than at the previous one: roughly $12 in 2012, $660 in 2016, $8,600 in 2020, and about $64,000 in 2024. Despite brutal bear markets in between, BTC has become more potent when the next halving arrives. This reinforces that Bitcoin’s value has grown over the long term, partly because the halving mechanism steadily constrains supply.
- Supply Shock and Market Cycle: The halving often marks the transition between Bitcoin market cycles. Typically, a halving is followed by a year or so of bullish action (the “bull market”), then a correction or bear market, and finally a recovery leading into the next halving. For instance, after the 2017 peak post-2nd halving, BTC retraced in the 2018 bear market, only to recover by 2020 just in time for the 3rd halving. Understanding this cyclical nature helps investors set realistic timelines – rallies have historically not been instant but played out many months after the halving.
It’s worth mentioning that while the correlation is strong, the halving isn’t the only factor driving prices. Each cycle coincided with broader crypto adoption waves and macroeconomic conditions that helped fuel demand. In 2013 (after the first halving), Bitcoin gained notoriety and early speculative interest. In 2017 (post-second halving), the ICO boom and mainstream media attention drove demand. In 2020–2021 (post-third halving), institutional adoption, COVID-era monetary stimulus, and crypto entering the mainstream all contributed to the rally. The halving acted as a supply catalyst amid these favorable conditions.
With this historical perspective in mind, let’s zoom into the most recent halving – what happened during the 2024 event?
Why Bitcoin’s Next Halving Matters to Beginners, Investors, and Traders
Bitcoin’s halving isn’t just tech jargon – it’s a pivotal event that affects everyone in the crypto market. With the April 2024 halving behind us and the next one due in 2028, understanding its impact is key for all types of participants. Here’s why the halving matters, whether you’re a newcomer, a long-term investor, or an active trader:
- Beginners: For those new to Bitcoin, halving is fundamental to why Bitcoin is often called “digital gold.” By cutting the mining reward in half every four years, Bitcoin enforces scarcity, much like a precious metal. Fewer new BTC being created can set the stage for higher prices over time. Understanding this concept helps newcomers see how Bitcoin’s value might grow in the long run. (Tip: Tools like the Bitcoin Rainbow Chart offer a visual guide to Bitcoin’s price cycles, showing how market sentiment shifts from lows to highs after each halving.)
- Long-Term Investors: History shows that Bitcoin’s supply shock from halving often precedes significant bull runs. Many investors anticipate these events as catalysts for price appreciation. In fact, after the first halving, Bitcoin’s price surged by tens of thousands of percent, whereas after the third halving, it rose by roughly 1,000%. This trend of diminishing returns means that while each halving has fueled growth, the percentage gains have been smaller each cycle. Savvy investors view the halving as a reason to remain bullish on Bitcoin’s future, but they also set realistic expectations. It’s wise to remember that other factors (like overall market conditions and adoption) play a role. Halving is a big puzzle piece, but not the only one.
- Active Traders: Traders often keep a close eye on halving countdowns because of the hype and volatility that can surround these events. Bitcoin’s price doesn’t usually skyrocket overnight on halving day – instead, the most dramatic gains have typically materialized in the months after the halving. For example, in the five months following the 2016 halving, Bitcoin’s price rose only modestly (~16%) before accelerating into a massive rally the following year. Short-term traders should be prepared for increased market chatter and swings around the halving. Some traders try to “buy the rumor and sell the news,” meaning prices might run up before the halving and briefly pull back around the event. The key for traders is to manage risk and stay informed – halving-driven volatility can present opportunities and surprise even seasoned market players.
When Was the Last Bitcoin Halving?

The last Bitcoin halving occurred on April 20, 2024. This was Bitcoin’s fourth halving event, reducing the mining reward from 6.25 BTC to 3.125 BTC per block. In the lead-up to this halving, the market was buzzing with anticipation. Unlike early halving that flew under the radar, the 2024 halving was watched by millions of investors worldwide – from retail crypto enthusiasts to Wall Street institutions – all wondering how it might affect Bitcoin’s price.
Leading up to April 2024, Bitcoin experienced a strong rally. BTC broke a new all-time high one month before the halving, reaching about $73,000 in March 2024. This was unusual. The prior all-time high wasn’t surpassed in previous cycles until after the halving. Many analysts attributed this early surge to growing institutional interest – for example, the approval of several spot Bitcoin ETFs in early 2024 meant large investors could quickly gain exposure to BTC, boosting demand. By the time of the halving day, Bitcoin was trading around the mid-$ 60,000 range (roughly $64k).
On April 20, 2024, at block height 840,000, the halving was executed. The Bitcoin community celebrated this protocol milestone; social media was abuzz as the “block reward” officially dropped to 3.125 BTC. Immediately, the new supply of Bitcoin fell from about 900 BTC to only 450 BTC daily. This was the start of a new era of even greater scarcity.
Market insights: Interestingly, the aftermath of the 2024 halving did not produce an immediate price explosion. Bitcoin’s price slightly declined in the weeks following the halving, consolidating after its big run-up. Some traders follow a “buy the rumor, sell the news” strategy – meaning much of the rally had occurred before the halving in anticipation, and short-term traders took profits around the event. On-chain data showed net outflows from Bitcoin ETFs in the months after the halving, suggesting some institutional profit-taking.
However, this cooldown was temporary. By late 2024 and into early 2025, Bitcoin resumed its upward trajectory. Macro events also played a role – for instance, renewed optimism in the global economy and possibly even geopolitical or policy factors gave Bitcoin another boost. By early 2025 (around ~10 months post-halving), the BTC price had climbed to fresh highs above the previous cycle’s peak of $69k. In other words, the long-term bullish trend remained intact, even if the short-term reacted with a hiccup. Investors who held onto their BTC through the halving ultimately saw significant gains as the market recovered and moved higher.
The 2024 halving underlined an important lesson: while Bitcoin’s halving creates an apparent structural shift in supply, market sentiment and timing can vary. It’s not a guarantee of instant price spikes but rather a fundamental tailwind that can align with bullish conditions over time. The “last Bitcoin halving” will be remembered as when Bitcoin was no longer a fringe asset but part of a global portfolio for many – a sign of how far we’ve come since the first halving in 2012.
Now, with four halving behind us, what do the charts and long-term trends tell us? Let’s examine the BTC halving chart and price trends to decode patterns from these past events.
BTC Halving Chart & Trends
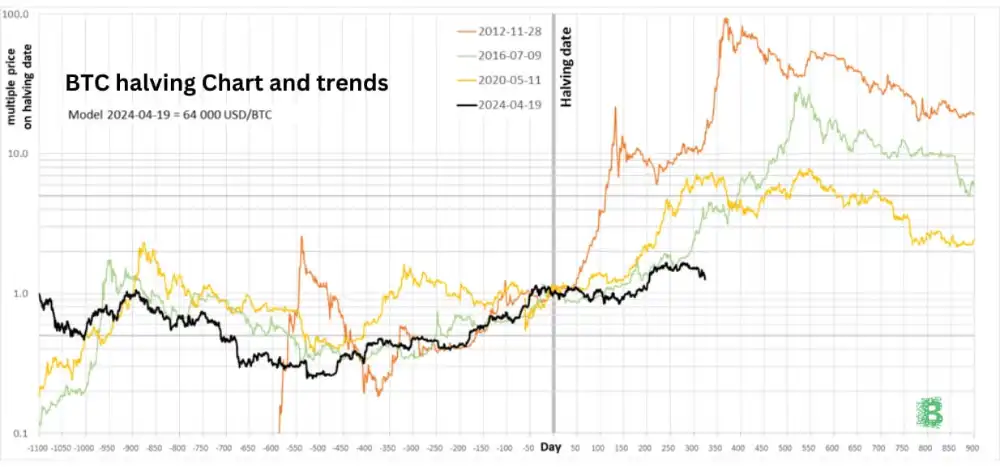
Bitcoin price chart: BTC/USD price history with the first three halving events marked (vertical lines for 2012, 2016, 2020). Each halving was followed by a notable increase in price in the subsequent year or two, as seen by the steep climbs after each event. Sources show Bitcoin’s price rose from around $12 at the 2012 halving to over $1,000 a year later, from ~$680 at the 2016 halving to nearly $20k by late 2017, and from ~$8.6k at the 2020 halving to about $66k at its 2021 peak.
When analyzing the BTC halving chart, a four-year cyclical pattern emerges clearly. Here are the key trends and takeaways:
- Pre-Halving Run-Up: Bitcoin’s price often rises months before the halving date. This was evident in 2016, 2020, and especially 2024, when strong rallies occurred in anticipation of the event. Traders and investors hype up the “halving narrative,” expecting reduced supply to increase prices, so many buy BTC in the lead-up. This demand can self-fulfill a price increase pre-halving. For example, in the 12 months leading to the 2020 halving, BTC climbed from lows around $3,500 (after the 2018 bear market) to about $8,000–9,000 just before the halving, recovering strongly alongside halving expectations. Similarly, before 2024’s halving, Bitcoin had risen from the ~$20k range (bear market lows) to over $60k.
- Post-Halving Corrections (Short-Term): BTC has seen short-term pullbacks or sideways movement immediately after some halving events. In the 2016 halving, Bitcoin’s price dipped nearly 30-40% in the weeks after the halving before surging a few months later. This phenomenon is often attributed to traders “selling the news” or miners briefly offloading more coins due to the reward cut. After the 2020 halving, BTC also traded flat to slightly down for a couple of months (summer 2020) before the actual rally kicked off in late 2020. As noted earlier, 2024 saw a modest dip post-halving before recovery. The lesson: the halving’s bullish impact usually has a lag. Markets may take time to digest the supply shock.
- Exponential Bull Runs (Mid-Term): Roughly 6 to 12 months after each halving, Bitcoin has historically hit its cycle peak price. The chart shows steep climbs corresponding to the year following the halving. For instance, about a year after the 2012 halving, BTC’s price went parabolic into late 2013. About 1–1.5 years after the 2016 halving, we saw the blow-off top in December 2017. And about 1–1.5 years after the 2020 halving, we got the November 2021 peak. These bulls were where the most significant gains of each cycle materialized. Investors who accumulated before or at the halving and held on through the following year reaped massive rewards historically. The pattern “Bitcoin reached the highest value 6 to 12 months after each halving” has held in past cycles.
- Bear Markets and Cycle Reset: Bitcoin entered multi-month (even multi-year) bear markets following those euphoric peaks. The chart illustrates that after the late 2013 peak, BTC fell sharply in 2014; after 2017’s peak, a harsh 2018 bear followed; after 2021’s peak, 2022 was a brutal down year. Yet, each bear market bottom was still higher than the pre-halving levels. Then, as the next halving approached, the cycle of recovery and rally began anew. This boom-bust rhythm tied to halving cycles is a defining characteristic of Bitcoin’s history. It’s not a smooth ride up, but a series of spikes and retracements – testing investors’ conviction.
The BTC halving chart illustrates a powerful historical trend: each halving has acted like a springboard for Bitcoin’s price, though with a delay and diminishing returns. The general trajectory has been up and to the right over the long term, punctuated by cyclical volatility. Past performance, of course, is not a guarantee of future results – but it’s a valuable guide. With that in mind, let’s turn to the future: What predictions can we make about the upcoming halving and Bitcoin’s outlook?
Predictions & Future Outlook
With the 2024 halving behind us, the next Bitcoin halving is expected around early 2028 (likely in April 2028, at a block height of ~1,050,000). The block reward will drop from 3.125 BTC to 1.5625 BTC at that fifth halving. This continual halving of the reward will further reduce the issuance of new bitcoins – to the point that by 2028, less than 225 BTC will be mined per day on average, and by the 2030s, the block reward will be fractions of a BTC. It’s all part of the journey toward the final 21 million BTC supply caps in 2140.
Conclusion
Bitcoin’s halving history tells a compelling story of an asset engineered for scarcity and a market that has responded in kind. We saw how bitcoin halving dates – from November 2012 to April 2024 – punctuate the timeline of BTC’s evolution. Each halving reduced the supply of new bitcoins and was followed by leaps in Bitcoin’s price, taking it from obscurity to a trillion-dollar asset class over a decade. The history of the BTC halving chart highlights this remarkable journey: early adopters witnessed BTC rise from a few dollars to thousands, and recent investors saw it climb into the tens of thousands, all under the guiding rhythm of the halving cycle.
We decoded the key halving dates and explored the “why” behind the hype. By cutting supply growth, halving has catalyzed Bitcoin’s value appreciation (though not without interim volatility). We examined when the last Bitcoin halving was – April 2024 – and learned that even in a more mature market, the halving still played a crucial role in shaping market trends. We analyzed BTC price trends around each halving, noticing patterns like pre-halving rallies, post-halving consolidations, and mighty bull runs in the ensuing year. And we’ve looked ahead to the future, recognizing that while past trends give hope for continued growth, each cycle can bring new twists.
From a beginner investor learning the ropes to an institutional investor managing billions, understanding Bitcoin’s halving is essential. It instills an appreciation for Bitcoin’s core value proposition: a controlled, predictable, and transparent supply in an age where fiat money can be expanded. This gives Bitcoin a different flavor from any traditional asset, and halving embodies that difference.
Keep the halving in perspective as you consider your investment or trading strategy. It’s not magic, but it is a powerful economic mechanism. Use the lessons from history: plan for volatility, think long-term, and align your strategy with your risk tolerance and goals. Bitcoin will continue to evolve, and so will the market’s reaction. However, one thing likely remains constant: every four years (approximately), the Bitcoin protocol will halve the block reward, and the world will watch with anticipation of what comes next.
In the end, Bitcoin’s story is one of innovation and resilience, and the halving cycle is a heartbeat that has paced its growth. By decoding the halving chart and history, we gain knowledge of key dates and trends and a deeper trust in the processes that make Bitcoin. At Brics Technology, we hope this comprehensive look at Bitcoin halving empowers you to navigate the crypto seas with greater confidence and insight.
Happy investing, and see you at the next halving!