Something unusual just happened on the charts, and it’s got crypto traders talking. For the first time ever, XRP has formed a golden cross against Bitcoin. It’s not just a technical milestone; it could mark a shift in market dynamics that puts XRP in the driver’s seat. With regulatory clouds finally clearing and momentum quietly building, many are wondering: Is this the moment XRP breaks away from the pack?
What is the XRP Golden Cross and Its Implications for Investors
The XRP Golden Cross happens when the short-term moving average (typically the 50-day MA) crosses above the long-term moving average (usually the 200-day MA). This pattern signals potential bullish momentum, suggesting that XRP’s recent price movement is outpacing its long-term trend. Historically, the Golden Cross has often foreshadowed price rallies, making it an exciting signal for investors.
Implications for XRP Investors:
- Potential for a Bullish Move
The Golden Cross is often viewed as a sign that the market could shift into a bullish trend. For XRP, this could be an opportunity to invest before prices increase. - XRP Gaining on Bitcoin
If XRP begins to outperform Bitcoin, investors may consider reallocating part of their portfolios into XRP for potentially better returns in the short term. - Increased Investor Confidence
The Golden Cross tends to generate buzz, which can boost confidence in XRP. With XRP’s strong use case in global payments and Ripple’s partnerships, this positive attention could lead to more investor interest. - Price Predictions and Caution
Some analysts are predicting significant price gains for XRP following the Golden Cross. However, it’s important to approach these predictions with caution as market conditions can change quickly. - Risk Management
The Golden Cross doesn’t guarantee future gains. Investors should monitor XRP’s price action closely and consider strategies like dollar-cost averaging to reduce risk.
In conclusion, the XRP Golden Cross is a strong indicator of potential bullish momentum. For investors, it presents an opportunity to consider XRP, but also a reminder to balance risk with reward as the market evolves.
Examining the Current XRP/BTC Golden Cross Price Dynamics
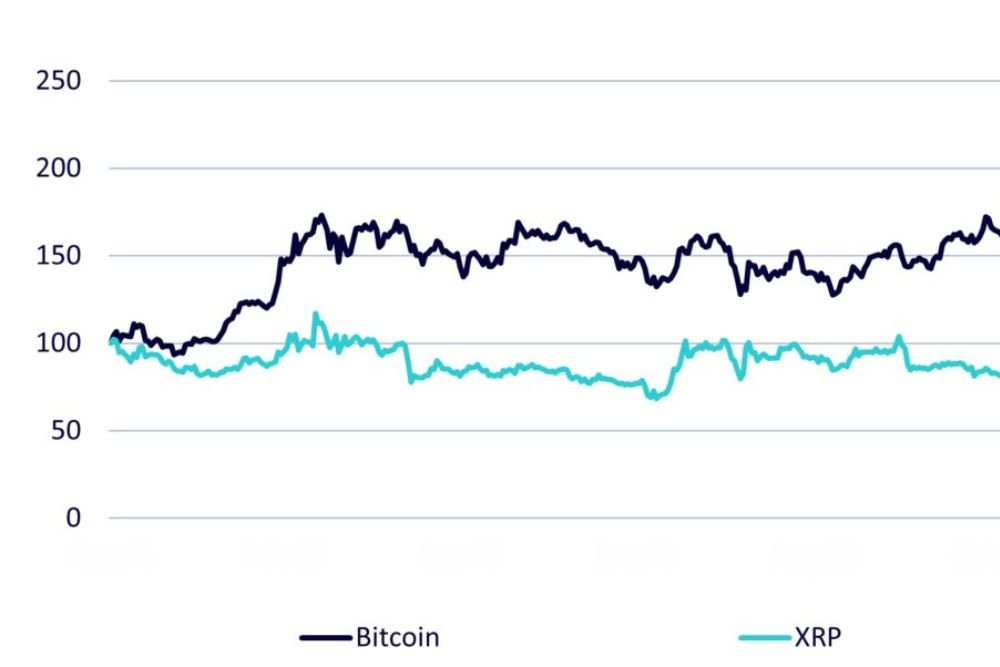
XRP quietly built its golden‑cross setup against Bitcoin by first hitting a multi‑year USD high above $3 in early 2025, then sliding into a tight 0.000022 to 0.000023 BTC range after peaking near 0.000032 BTC.
That calm sideways action let the 50‑day average drift above the 200‑day average right in the middle of consolidation, a textbook sign of steady accumulation instead of a panic‑driven spike. Now the big question is whether XRP can stay above those moving averages and climb past resistance around 0.00002570 BTC. Doing that would turn this golden cross into a real bullish catalyst, but falling back below on weak momentum would wash away the signal and send expectations back to neutral.
In US dollar terms, XRP has stubbornly held between two and three dollars even as Bitcoin cooled off, hinting that buyers have been quietly stacking positions.
Traders are watching for a convincing push above $2.50, with $3 back in sight, ideally on noticeably higher trading volume. If XRP can turn that move into sustained momentum, it’ll prove the golden cross is the launchpad for a genuine bull run otherwise, the trend stays in limbo until buyers show enough conviction.
The Impact of Regulatory Developments on XRP’s Price Following the Golden Cross
Right when XRP’s fifty-day moving average climbed above its two-hundred-day moving average, the SEC dropped its last appeal, declaring XRP not a security on public exchanges. That verdict blew away four years of legal overhang that had kept investors on the sidelines. Traders who had waited for clarity jumped in immediately, sending both BTC and USD prices higher while trading volumes surged. That convergence of technical signal and regulatory relief turned the golden cross into a powerful confirmation of genuine demand rather than a false alarm.
Talk of an XRP exchange-traded fund and the launch of institutional XRP funds opened doors to new pools of capital. Every nod from regulators and every new investment vehicle under construction added fuel to the rally and helped XRP push through key resistance levels.
While a sudden policy reversal or fresh lawsuit could still trigger profit taking, the clear legal sky now gives bulls the upper hand. With those moving averages acting as a support floor, traders have a simple gauge for dips, making this setup one of the most compelling breakout opportunities XRP has seen in years.
Technical Indicators That Complement the Golden Cross for XRP and Bitcoin
While the golden cross is the star of the show right now, seasoned traders know it’s wise to look at other technical indicators to paint a fuller picture of the trend. So, what other signals should one watch alongside XRP’s golden cross (and even Bitcoin’s own charts) to gauge the strength of this potential bull run?
Several key indicators can complement the golden cross and help confirm if the bullish momentum is real:
Trading Volume
A golden cross accompanied by a significant uptick in volume is far more convincing. Rising volume during price advances means more market participants are buying in, lending credibility to the breakout. If XRP’s price starts climbing post-golden cross, we want to see above-average volume trading days, which would indicate strong conviction behind the move. (More on volume in the next section.)
Relative Strength Index (RSI)
The RSI is a momentum oscillator that can show whether an asset is overbought or oversold. Leading up to XRP’s golden cross, if the daily or weekly RSI has been trending upward but is still in a reasonable range, it suggests there’s room for further upside without being immediately overbought. A healthy bull run often features RSI riding high (but not maxed out) for a period.
Moving Average Convergence Divergence (MACD)
This indicator helps visualize momentum and potential trend changes. If the MACD line for XRP turns positive (crosses above the signal line) around the same time as the golden cross, it reinforces the bullish signal. On Bitcoin’s chart, if a MACD bullish crossover is happening too, it could mean the entire crypto market sentiment is improving in tandem.
On-Chain Metrics
Technical analysis isn’t just about price charts. On-chain data can provide insight into what long-term holders and large players are doing. For XRP, one interesting metric noted by analysts is the MVRV ratio (Market Value to Realized Value). In fact, XRP’s MVRV recently flashed a kind of “golden cross” of its own – a rare bullish alignment between short-term and long-term holder metrics.
The last time that happened, XRP’s price skyrocketed by hundreds of percent. Additionally, monitoring whale addresses (large XRP holders) can be telling: a spike in whale accumulation or active addresses often precedes major price moves.
Bitcoin’s Health
Because Bitcoin still heavily influences the crypto market, keeping an eye on Bitcoin’s technical health is important. Bitcoin itself experiencing a golden cross or other bullish pattern (for example, Bitcoin’s price holding above its own 50-day and 200-day MAs) would create a tailwind for altcoins like XRP.
Conversely, if Bitcoin were to unexpectedly stumble (say, dropping below key support or flashing a death cross, the bearish opposite pattern), it could spoil the party for everyone. Thus, confirmation across multiple major coins provides more confidence.
By watching these complementary indicators, investors can verify whether XRP’s golden cross is supported by broader market momentum and strength. For instance, if we see XRP’s golden cross accompanied by rising volume, a bullish MACD, increasing RSI, and evidence of big investors buying in, that paints a picture of a robust rally forming.
Previous Golden Crosses in Cryptocurrencies and Their Market Behavior
Golden crosses where the 50-day moving average crosses above the 200-day moving average are often seen as bullish technical indicators in crypto markets. While not a guarantee of price surges, many golden crosses in major cryptocurrencies have preceded significant rallies. Below is a snapshot of how various coins have behaved following such signals.
| Cryptocurrency | Date of Golden Cross | Market Context | Result / Price Movement |
| Bitcoin (BTC) | Late 2015 | End of multi-year bear market | Kicked off 2016–2017 bull run with massive gains |
| Bitcoin (BTC) | April 2019 | Recovery from 2018 crypto winter | BTC rose from ~$5K to ~$12K in a few months |
| Bitcoin (BTC) | Mid 2020 | Post-pandemic crash rebound | Preceded the 2020–2021 bull run to ATHs |
| Bitcoin (BTC) | Mid 2021 & Early 2024 | Market consolidation | Led to rallies and sentiment shifts |
| Bitcoin (BTC) | 2014 | Short-lived bullish attempt | Failed due to negative news; trend reversed |
| Ethereum (ETH) | Early 2020 | Recovery before DeFi boom | Entered strong rally, new ATHs in 2021 |
| Litecoin (LTC) | April 2019 | Technical momentum + halving hype | Price nearly doubled in ~2 months |
| Cardano (ADA) | Mid 2020 | Altcoin revival phase | Surged during 2021 bull cycle |
| XRP | Early 2024 | Regulatory wins, adoption rise | Still developing; high bullish expectations |
Golden crosses often act as early bullish signals, especially when combined with positive sentiment and strong fundamentals. While not infallible, history shows that they frequently align with the beginning of major uptrends, particularly for large-cap coins like Bitcoin and Ethereum. For XRP, its current setup could mirror these patterns if broader market conditions support it.
Comparative Historical Performance of XRP During Bull Runs
XRP has a history of explosive moves during bull markets, often outperforming Bitcoin when conditions are right. In the legendary 2017 bull run, XRP rose from fractions of a cent to over $3.30, delivering gains of around 30,000% far outpacing Bitcoin’s ~20x rally.
This massive surge was fueled by XRP’s narrative as a fast, low-cost bridge currency and intense investor interest. During the 2020–2021 bull run, however, XRP’s performance was more muted due to the SEC lawsuit and resulting delistings. Still, XRP rallied from around $0.20 to $1.90 roughly a 9x gain beating Bitcoin’s ~3x move in that same period, though not matching its past explosive returns.
By late 2024 and into 2025, with increasing regulatory clarity, XRP has once again started to gain momentum, revisiting the $2–$3 range. Historically, XRP tends to lag behind Bitcoin’s initial move and then spike sharply during “altseason” phases, where altcoins outperform as Bitcoin consolidates.
With the recent golden cross and improved market sentiment, analysts are eyeing a possible repeat of this pattern. Some even speculate on targets like $5 or higher in a full-blown bull scenario. While future performance isn’t guaranteed, XRP’s past rallies show its potential for dramatic gains when conditions align, giving bulls reason to be optimistic.
Final Thought: Could XRP’s Golden Cross
XRP’s historic golden cross against Bitcoin marks a pivotal turning point that has crypto traders buzzing. While technical signals alone aren’t crystal balls, this rare formation coupled with clearer regulatory skies sets a compelling stage for XRP’s next chapter.
From institutional interest to supportive on-chain metrics, multiple factors now align favorably, creating one of the strongest bullish setups XRP has seen in years. As an investor, keep your eyes wide open, stay alert to market shifts, and track these signals closely. After all, in crypto markets, opportunities like this don’t come knocking often, and when they do, those ready to answer stand to benefit the most.
FAQs
A golden cross occurs when a short-term moving average (usually the 50-day) crosses above a long-term moving average (typically the 200-day). This crossover is viewed as a bullish technical signal, suggesting that momentum is shifting upward and a sustained rally may follow.
XRP’s golden cross especially against Bitcoin is a rare and powerful signal. It indicates that XRP’s momentum is outpacing Bitcoin’s over a significant timeframe. While not a guarantee, historically, golden crosses have often preceded strong rallies, and XRP’s current setup has analysts watching for a potential breakout.
To validate the golden cross, it’s smart to also monitor:
Volume (rising volume adds strength to the signal)
RSI (Relative Strength Index) — indicates whether XRP is overbought or still has room to run
MACD (Moving Average Convergence Divergence) confirms momentum shifts
On-chain metrics — like MVRV ratios and whale accumulation
These tools provide extra layers of confirmation that a true trend is developing.
Yes. Some notable golden crosses include:
Bitcoin (2015): Marked the start of the 2016–2017 bull run
Bitcoin (2019 & 2020): Preceded major price recoveries
Ethereum (2020): Happened just before ETH exploded in the DeFi boom
Litecoin & Cardano (2019–2020): Followed by strong rallies
Historically, golden crosses have often aligned with major trend reversals or bullish breakouts — especially in larger-cap coins.
XRP has shown a pattern of lagging early and then surging hard. In 2017, XRP outperformed Bitcoin by a massive margin, delivering over 30,000% gains from its lows. In 2021, despite legal setbacks, XRP still rallied ~9x, beating Bitcoin’s 3–4x rise. Historically, when market conditions favor XRP, it has delivered explosive returns, especially during altcoin-focused phases of a bull market.